Separate performance from redesign
Vodafone wanted to understand whether improving web performance could affect business outcomes. In an A/B test published by web.dev on 17 March 2021, the optimized landing page and baseline were visually and functionally identical; performance optimization was the distinguishing change [1]. This design matters because it narrows the interpretation: the reported sales difference was associated with the tested performance work, rather than a new layout or feature.
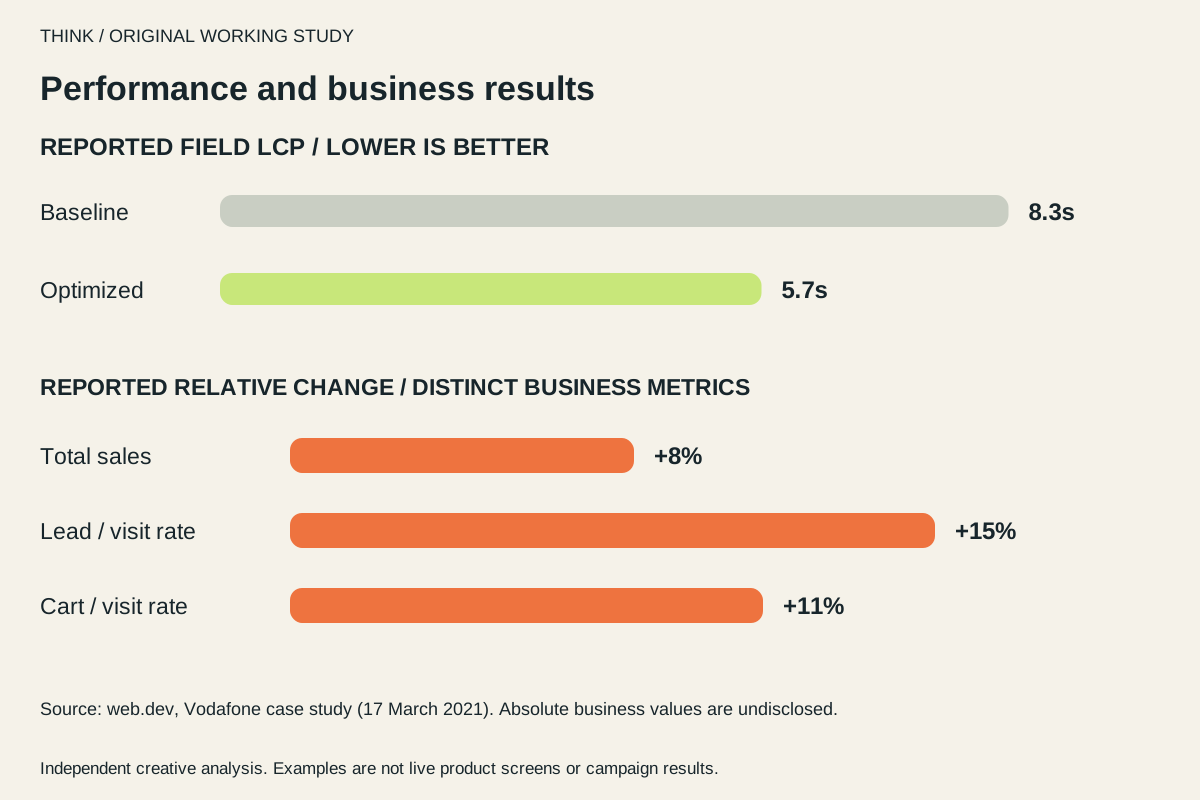
The experiment sent half of the traffic to each version, with traffic from paid media channels including display, mobile platforms, search, and social [1]. The article reports that the optimized version had a 31% improvement in field LCP and delivered 8% more total sales, a 15% improvement in lead-to-visit rate, and an 11% improvement in cart-to-visit rate [1]. These are relative reported changes, not percentage-point increases.
Start with the paid landing page experience
For a team assessing its own paid-campaign landing pages, our interpretation is to begin by mapping the path from click to meaningful action. Segment the analysis by campaign and device, then check whether the page's largest visible content loads promptly and whether the interaction path remains usable. The purpose is to locate friction that could make a visitor wait before seeing or using the offer, not to assume that every slow page has the same cause.
Vodafone's documented changes included moving a widget's rendering logic from client-side to server-side, server-rendering critical HTML, and optimizing images, including resizing the hero image [1]. A diagnostic review elsewhere could examine analogous bottlenecks, but those specific implementations should not be copied without evidence that they apply.
Workshop: separate the reported result from your test plan
The original chart redraws the source’s LCP and business figures without inventing absolute sales counts. The calculator underneath is a separate hypothetical conversion experiment: an 8% relative uplift from a 2% baseline means 2.16%, a difference of 0.16 percentage points.
| Assumption | Hypothetical example | Interpretation |
|---|---|---|
| Baseline / target | 2.00% → 2.16% | Neither conversion rate is disclosed by Vodafone. |
| Significance / power | Two-sided 5% / 80% | Equal allocation; independent binary observations. |
| Required observations | 124,891 per arm / 249,782 total | An approximate fixed-horizon plan, not a stopping signal. |
The calculation uses a pooled variance under the null and an unpooled variance under the alternative, with normal quantiles of 1.959964 and 0.841621. For p₀, p₁ and p̄=(p₀+p₁)/2, n per arm is the ceiling of [zα√(2p̄(1−p̄)) + zβ√(p₀(1−p₀)+p₁(1−p₁))]² / (p₁−p₀)². This is a two-sided normal approximation without continuity, clustering, sequential or multiple-comparison adjustments; the statsmodels documentation explains a related normal-approximation sample-size approach. [3]
Choose a baseline supported by your own eligible traffic and a smallest worthwhile difference before launch. The result is observations, not days: account for traffic eligibility, repeat users, a full business cycle and instrument checks when scheduling a real experiment. A fixed-horizon calculation does not make repeated significance checks valid, and this planning example does not establish power for Vodafone’s reported total-sales result.
Use the case as a reference, not a forecast
The Vodafone result offers a concrete reason to test performance changes alongside business measures. For illustration only, if a hypothetical page had 1,000 sales in a defined baseline period, an 8% relative increase would correspond to 1,080 sales under comparable conditions. This example is arithmetic, not Vodafone's undisclosed absolute sales count and not a prediction for another business. Vodafone's source redacts absolute business values [1].
Keep lab checks and field evidence distinct
A proposed implementation review would use lab measurements during development to catch regressions, then monitor real-user field data after release. Core Web Vitals guidance explains that field measurement reflects user experience across devices and conditions, while lab testing is useful before release; neither should be mistaken for the other [2]. LCP is a loading metric, and the guidance recommends evaluating Core Web Vitals at the 75th percentile, segmented by mobile and desktop [2].
For an experiment, preserve the original page as a control, verify that the variants differ only in intended performance work, and check analytics assignment and event collection before interpreting outcomes. This is suggested QA, not a claim about Vodafone's undocumented procedures.
Decide what another test can establish
A new site should define its primary commercial measure before launch, such as sales per eligible visit, and treat lead-to-visit or cart-to-visit measures as supporting diagnostics. It should also set a stopping rule and check whether traffic allocation, campaign mix, or tracking changes compromise comparability. These are proposed safeguards; they are not reported details of Vodafone's test.
The case establishes the results reported for Vodafone's landing-page experiment, but it does not establish the same uplift for another site, identify the effect of every individual optimization, or disclose absolute business values [1]. Core Web Vitals field reporting can help reveal what users experience, while a controlled business experiment can test whether a specific change coincides with a commercial difference [2]. The practical next step is to audit one high-value landing page, formulate a narrow performance hypothesis, and run a properly instrumented test before making a wider investment.
Sources & useful references
- web.dev: Vodafone performance A/B test
- web.dev: Core Web Vitals
- statsmodels: two-proportion sample-size approximation
Results are attributed to the original publisher. Proposed tests and creative recommendations are our analysis.